
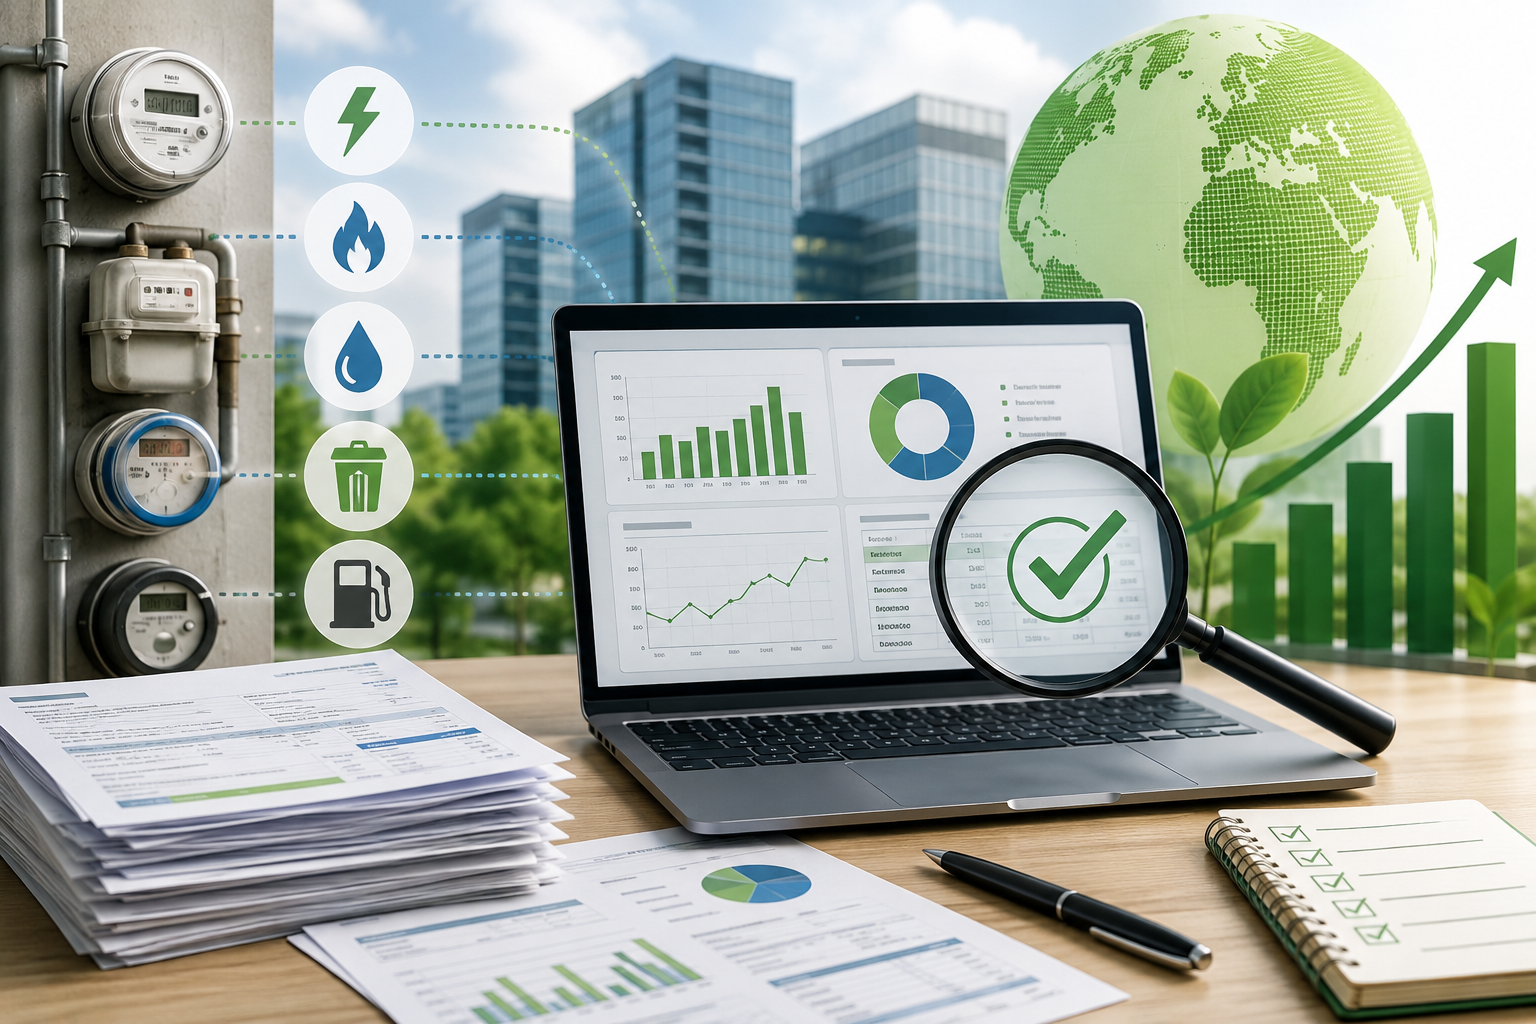
Benchmarking one building is a task. Benchmarking fifty or more buildings is an operating system…
Utility Bill Cleanup
Utility bills are often the starting point for ESG reporting, energy audits, benchmarking, and emissions calculations. They are also where many reporting problems begin.
For organizations with multiple properties, utility bill data rarely arrives in a clean, consistent format. Bills may be missing. Account numbers may change. Meter readings may overlap or skip a month. Costs may appear without usage. Water, gas, electricity, waste, and fuel data may live in different portals, spreadsheets, PDFs, and inboxes.
That mess matters because ESG and emissions reporting depends on data that can be traced, checked, and explained. If the underlying utility data is incomplete or inconsistent, the report becomes harder to trust.
Why utility bill cleanup matters
Utility bill cleanup is not just an administrative task. It is the foundation for accurate environmental reporting.
When utility data is clean, teams can:
- Build faster Scope 1, 2, and 3 emissions reports.
- Reduce rework during ESG reporting cycles.
- Identify missing usage or cost records before reporting deadlines.
- Compare properties, meters, and time periods with more confidence.
- Spot unusual usage patterns that may point to leaks, waste, theft, or operational issues.
- Support audits, benchmarking, and internal decision-making with clearer evidence.
When utility data is messy, the opposite happens. Teams spend too much time chasing bills, checking formulas, explaining gaps, and rebuilding spreadsheets.
Common utility bill data problems
Most organizations do not have one single utility data problem. They have a cluster of small issues that add up over time.
Common problems include:
- Missing bills
A month is skipped, a PDF was never downloaded, or a vendor portal no longer shows older records. - Inconsistent billing periods
One bill covers 28 days, another covers 35 days, and another includes an adjusted or corrected period. - Duplicate bills
The same bill is entered twice, often because a revised bill or downloaded PDF looks slightly different. - Changing account or meter numbers
Utility accounts may be renamed, transferred, consolidated, or replaced. - Usage without cost, or cost without usage
Some records include dollars but not consumption. Others include usage but not a clean cost breakdown. - Different units of measure
Electricity, natural gas, water, waste, and fuel may use different units across vendors, regions, or reporting systems. - Manual spreadsheet errors
Copy-and-paste workflows can introduce broken formulas, shifted columns, incorrect dates, or mismatched property names.
These issues are common. The key is to find and resolve them before they become reporting problems.
Step 1: Create one utility data inventory
Start by listing every property, utility account, meter, and data source in one place.
At minimum, capture:
- Property name
- Property address
- Utility type
- Utility provider
- Account number
- Meter number, when available
- Billing frequency
- Data source or portal
- Internal owner
- Notes on known gaps or exceptions
This inventory becomes the map for cleanup. Without it, teams are often trying to fix individual bills without understanding the full data environment.
For multi-property organizations, this step is especially important. A missing account at one building or a duplicated meter at another can distort portfolio-level reporting.
Step 2: Standardize the fields before analyzing the data
Before reviewing trends or emissions impact, standardize the structure of the dataset.
Consistent fields should include:
- Property
- Utility type
- Provider
- Account or meter
- Billing start date
- Billing end date
- Usage
- Usage unit
- Cost
- Currency
- Source file or record
- Notes or exception flags
This does not mean every bill will be perfect. It means every record should have a consistent place for the information that is available.
Standardization also makes it easier to identify what is missing. A blank usage field, missing billing end date, or unusual unit should stand out immediately.
Step 3: Check for missing months and overlapping periods
The next cleanup step is to check continuity.
For each property, account, and meter, review the timeline and look for:
- Missing months
- Overlapping billing periods
- Unusually long or short billing periods
- Duplicate date ranges
- Sudden gaps after an account number change
- Records that appear in the wrong property or utility category
- This is where many teams discover that their data looked complete at a glance but had hidden gaps.
For example, a property may show twelve electricity bills for the year, but two may cover the same month while another month is missing. A spreadsheet total may still look plausible, even though the underlying timeline is wrong.
Step 4: Flag exceptions instead of hiding them
Not every data issue can be solved immediately. Some bills may be unavailable. Some provider portals may not show older records. Some properties may have changed ownership or management during the reporting period.
The important thing is to flag exceptions clearly.
Useful exception labels include:
- Missing bill
- Estimated usage
- Corrected bill
- Duplicate removed
- Billing period overlap
- Account changed
- Unit conversion needed
- Manual entry required
- Needs provider follow-up
This makes the reporting process more transparent. It also helps sustainability, facilities, finance, and operations teams see which issues need action and which have already been reviewed.
Step 5: Reconcile usage and cost
Utility bill cleanup should check both consumption and cost.
Usage is often the foundation for emissions reporting. Cost is often the signal that helps teams identify operational or financial issues.
Review both sides:
- Does the usage look reasonable compared with prior periods?
- Does the cost match the expected rate pattern?
- Are there demand charges, service fees, or adjustments that explain changes?
- Is there a major cost increase without a matching usage increase?
- Is there usage but no cost?
- Is there cost but no usage?
These questions help teams catch errors and surface opportunities. A spike may be a data problem, but it may also reveal a leak, equipment issue, billing error, or efficiency opportunity.
Step 6: Keep the audit trail
For ESG reporting and benchmarking, the final number is not enough. Teams also need to know where the number came from.
A strong utility data process preserves the audit trail by linking each record back to its source.
That source may be:
- A PDF bill
- A utility portal export
- A spreadsheet from a property manager
- A vendor report
- A manual note from a facilities or finance team member
The goal is simple: if someone asks where a usage figure came from, the team should be able to answer quickly.
This is especially important when preparing reports that must be reviewed by internal stakeholders, consultants, auditors, or regulatory programs.
Step 7: Move from cleanup to monitoring
Utility bill cleanup should not be a once-a-year scramble.
The better approach is to turn cleanup into an ongoing monitoring process. That means checking for missing bills, unusual usage, duplicate records, and inconsistent dates throughout the year instead of waiting until the reporting deadline.
Ongoing monitoring helps teams:
- Reduce reporting cycle time.
- Catch data problems earlier.
- Identify leaks or waste sooner.
- Improve confidence in emissions reporting.
- Create a cleaner foundation for year-over-year comparisons.
This is where software can make a major difference. Spreadsheet-based workflows can work for small datasets, but they become difficult to manage across many properties, utilities, accounts, and reporting periods.
How Verdafero helps
Verdafero helps organizations track, report, and reduce environmental impact by monitoring utility data and producing fast, accurate Scope 1, 2, and 3 emissions reports.
Verdafero’s utility monitoring software securely monitors and analyzes electricity, natural gas, water, waste, and fuel data across properties. That gives sustainability, facilities, operations, and finance teams a clearer way to manage utility data, find exceptions, and prepare reporting that is easier to trust.
Verdafero Consulting also supports organizations with sustainability consulting, auditing, ENERGY STAR® benchmarking, certification services, and project management.
Together, the software and consulting support help teams move from scattered utility records to cleaner reporting and better decisions.
The takeaway
Utility bill data cleanup is not busywork. It is the work that makes ESG reporting credible.
When bills are missing or inconsistent, teams need a process that can identify gaps, standardize records, preserve the audit trail, and turn utility data into reporting-ready information.
The organizations that do this well are not just preparing better reports. They are also building a better operating system for environmental performance.
If your organization is ready to make ESG reporting easier to manage and easier to trust, visit Verdafero’s website to learn more and schedule a demo. See how utility data can become a clearer path to faster reporting, better decisions, and measurable environmental progress.
Related Posts



Comments (0)