Benchmarking one building is a task. Benchmarking fifty or more buildings is an operating system…
ESG Reporting for Commercial Real Estate: A Practical Guide
Commercial real estate teams are being asked to answer bigger questions, faster: What’s our environmental impact across the portfolio? Are our numbers defensible? What will it take to reduce emissions and utility spend—without turning reporting into a quarterly fire drill?
The challenge is that most CRE organizations still manage utility and emissions data in a patchwork of portals, invoices, spreadsheets, and one-off consultant files. That approach can work for a single building—but it breaks down when you’re managing a portfolio, multiple fuels, multiple stakeholders, and rising expectations for transparency.
This guide walks through what “ESG reporting” typically means in a real estate context, where reporting efforts get stuck, and a practical path to cleaner data, faster reporting, and credible results you can act on.
ESG reporting in CRE (plain-language definition)
In commercial real estate, ESG reporting is the process of tracking and communicating key environmental, social, and governance performance indicators across a building or portfolio.
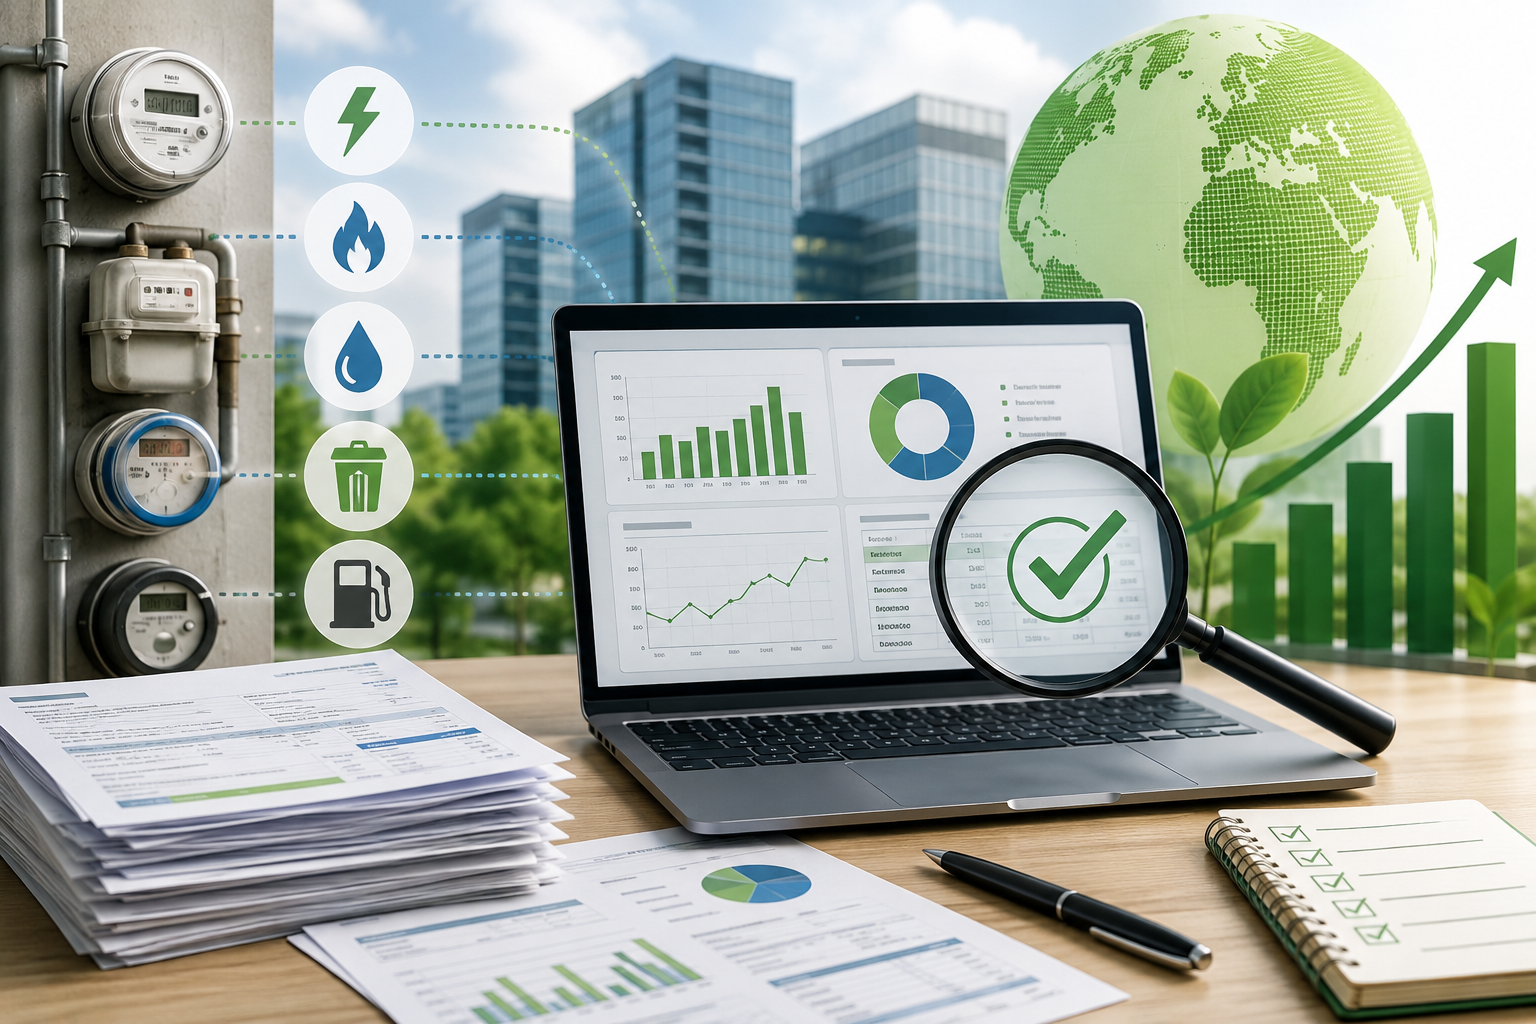
For most teams, the “E” (environmental) side is where the hardest work lives—because it depends on high-volume, high-variance operational data like:
- Electricity, natural gas, water, waste, fuel (and sometimes refrigerants)
- Utility costs and consumption patterns over time
- Building and occupancy context that helps explain the numbers
- Emissions calculations that turn activity data into Scope 1, 2, and (in some cases) 3 reporting
Done well, ESG reporting gives stakeholders a clear picture of performance and a roadmap for reduction. Done poorly, it becomes a scramble to assemble numbers that are difficult to defend and even harder to use.
Why ESG reporting gets hard at the portfolio level
The most common failure mode isn’t lack of effort—it’s lack of a reliable system for getting consistent, auditable data across properties.
Here are the friction points that show up repeatedly in CRE portfolios:
Utility data is scattered
- Bills and portals differ by property, provider, and region.
- Teams spend time hunting down files instead of interpreting trends.
Data quality issues compound quickly
- Gaps, duplicates, unit mismatches, and account changes aren’t caught early.
- Errors in one building can distort portfolio totals.
Reporting cycles turn into a “fire drill”
- Every deadline becomes a bespoke project.
- Knowledge lives in a few people’s heads or in brittle spreadsheets.
Numbers are hard to defend
- Stakeholders ask: “Where did this come from?” and “Can we reproduce it?”
- Without clean inputs and documented methods, confidence drops.
Insights don’t translate into action
- Even when the reporting is complete, teams struggle to pinpoint where waste, leaks, or improvement opportunities are coming from.
What “good” looks like: a practical ESG reporting standard for CRE
You don’t need a perfect, enterprise-wide transformation to improve ESG reporting. You need a repeatable pipeline that produces results stakeholders can trust.
At a practical level, strong CRE ESG reporting tends to share these traits:
- Fast reporting: the reporting cycle shortens over time, rather than expanding.
- Accurate reporting: data issues are identified and resolved systematically, not manually at the end.
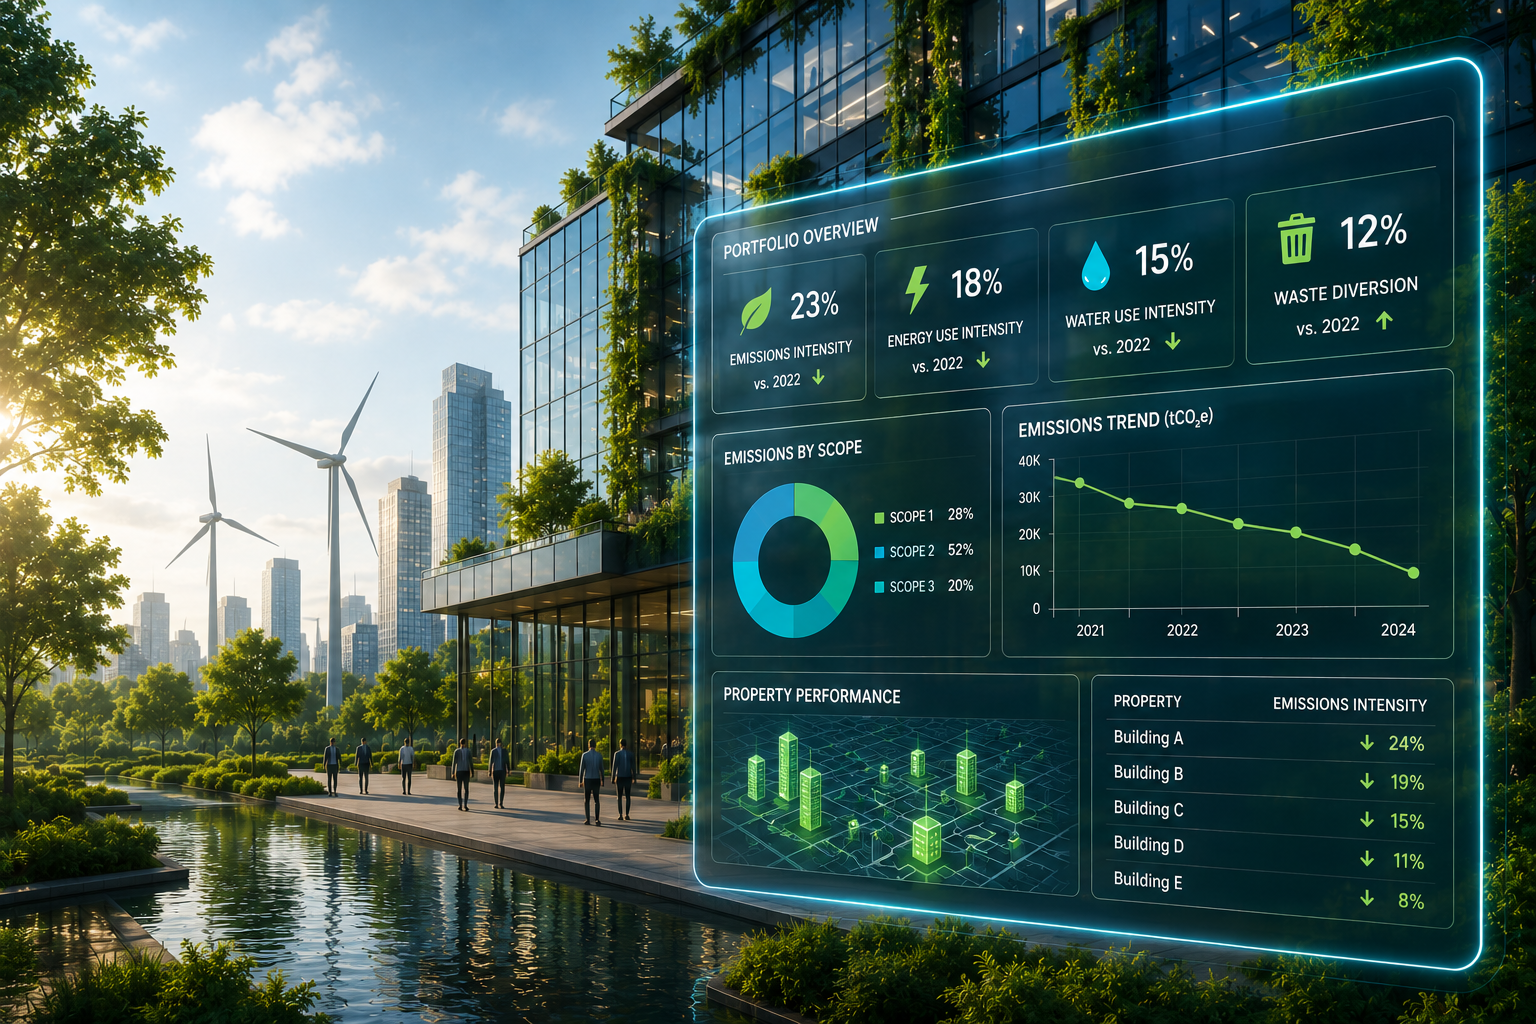
- Portfolio visibility: you can compare properties and understand drivers, not just totals.
- Multi-utility coverage: electricity, natural gas, water, waste, fuel—aligned in one view.
- Actionable insights: the reporting helps identify leaks, theft, inefficiencies, and upgrade opportunities—not just compliance outputs.
A step-by-step approach to improving ESG reporting (without rebuilding everything)
If your current process is spreadsheet-heavy, the goal isn’t to throw away what works. It’s to reduce fragility and increase confidence.
Step 1: Define your reporting scope and audience
Start with two questions:
- Who is this for (owners, asset management, sustainability, finance, tenants, lenders)?
- What decisions will this reporting support (compliance, benchmarking, capex planning, investor updates)?
Then clarify the minimum set of metrics you need to report consistently across the portfolio.
Step 2: Centralize and normalize utility data
This is where most of the leverage lives. Build a system that can:
- Ingest utility data across providers and formats
- Maintain a clean account/property mapping
- Flag missing months, anomalies, and outliers early
When utility data is centralized and standardized, everything downstream gets easier.
Step 3: Produce emissions-ready reporting (Scope 1, 2, and 3 where applicable)
When you translate operational data into emissions outputs, you want speed and defensibility.
In plain terms:
- Scope 1 covers direct emissions from sources you control (often fuels burned on-site).
- Scope 2 covers emissions from purchased electricity.
- Scope 3 can apply to parts of the value chain (often more complex and category-dependent).
If your audience is broad, include a one-sentence gloss like the above so the report stays readable.
Step 4: Add analysis that leads to reductions (not just reporting)
Once the reporting is stable, the reporting pipeline can do more than “produce numbers.” It can help you:
- Identify unusually high consumption or spend
- Spot potential leaks or abnormal usage patterns
- Prioritize properties for upgrades based on measurable impact
- Track progress in a way that’s explainable to stakeholders
Where Verdafero InSights fits: from messy utility data to compliant, readable reporting
Verdafero InSigfhts helps organizations track, report, and reduce environmental impact by securely monitoring utility data across properties and producing fast, accurate Scope 1, 2, and 3 emissions reports.
We combine:
- Patented utility monitoring software that centralizes and analyzes multi-utility data across a portfolio, and
- Sustainability consulting services to support benchmarking, auditing, and program implementation.
The result is reporting that is easier to trust—and easier to repeat—plus visibility that helps teams find efficiency opportunities.
A simple starting point (if you’re early)
If your environmental reporting process currently depends on manual spreadsheet wrangling, start with one move: centralize your utility data and create a consistent monthly reporting cadence.
Once the data pipeline is stable, you can layer on portfolio comparisons, emissions reporting, and reduction-focused insights without rebuilding from scratch each cycle.
If you’re responsible for ESG or environmental reporting across commercial properties—and you want reporting that is faster, easier to trust, and actually useful—request a Verdafero InSights demo for commercial real estate ESG reporting.
Related Posts